Thursday, October 31, 2013

2014 Malware and Memory Forensics Training Schedule Part 2

The Volatility Team would like to announce that our first public training on the East Coast for 2014 will take place in New York City on May 5th - 9th, 2014.

Instructors: Michael Ligh (@iMHLv2), Andrew Case (@attrc), Jamie Levy (@gleeda)

To request a link to the online registration site or to receive a detailed course agenda/outline, please send an email voltraining [[ at ]] memoryanalysis.net.

We have some more feedback from our Amsterdam class to share with you:

"An excellent technical malware course, highly recommended!" - Tom (Price Waterhouse Cooper)
"I find I have much more ways of success in my work with malware analysis.  Volatility is a great tool, keep up the good work!!!" - Goran (CERT-SE)
 "Great contents, expert teachers, hands on examples" - Boudewijn (NCSC-nl) 
 "It was great experience and mind blowing info.  The thing I appreciated the most were the graphics to help with visualisation and putting the Windows internals info in a goal and purpose view." - Anonymous 
"I think this is a really nice course and the best course I have had so far" -  Monnappa (Cisco)

As always, we constantly update our course materials and this course will include new modules on Windows 8 and structured memory analysis of TrueCrypt.These represent some of the latest advances in memory forensics, and by taking the class you can be among the first to learn the new skills firsthand.

This is the only memory forensics course officially designed, sponsored, and taught by the Volatility developers. One of the main reasons we made Volatility open-source is to encourage and facilitate a deeper understanding of how memory analysis works, where the evidence originates, and how to interpret the data collected by the framework's extensive set of plugins. Now you can learn about these benefits first hand from the developers of the most powerful, flexible, and innovative memory forensics tool.

If studying in the "Big Apple" doesn't suit you remember that we also have offerings in San Diego, CA (January 20th - 24th) and London, UK (June 9th - 13th) in 2014!

Friday, October 25, 2013

Volatility 2.3 Released! (Official Mac OS X and Android Support)

The Volatility Foundation is thrilled to announce the official release of Volatility 2.3! While the main goal of this release was Mac OS X (x86, x64) and Android Arm support, we also included a number of other exciting new capabilities! Highlights of this release include:

Mac OS X:
    * New MachO address space for 32-bit and 64-bit Mac memory samples
    * Over 30+ plugins for Mac memory forensics

Linux/Android
    * New ARM address space to support memory dumps from Linux and Android devices on ARM hardware
    * Plugins to scan Linux process and kernel memory with yara signatures, dump LKMs to disk, and check TTY devices for rootkit hooks
    * Plugins to check the ARM system call and exception vector tables for hooks

Windows
    * New plugins:
        - Parse IE history/index.dat URLs
        - Recover shellbags data
        - Dump cached files (exe/pdf/doc/etc)
        - Extract the MBR and MFT records
        - Explore recently unloaded kernel modules
        - Dump SSL private and public keys/certs
        - Display details on process privileges
        - Detect poison ivy infections
        - Find and decrypt configurations in memory for poison ivy, zeus v1, zeus v2 and citadelscan 1.3.4.5

    * Plugin Enhancements:
         - Apihooks detects duqu style instruction modifications
         - Crashinfo displays uptime, systemtime, and dump type
         - Psxview plugin adds two new sources of process listings from the GUI APIs
         - Screenshots plugin shows text for window titles
         - Svcscan automatically queries the cached registry for service dlls
         - Dlllist shows load count to distinguish between static and dynamic loaded dlls

New Address Spaces
    * VirtualBox ELF64 core dumps
    * VMware saved state (vmss)
    * VMware snapshot (vmsn) files
    * FDPro's non-standard HPAK format
    * New plugins: vboxinfo, vmwareinfo, hpakinfo, hpakextract

We also wanted to take this opportunity to recognize those on the development team who's continued dedication to open source forensics and the Volatility community has made this release possible: Mike Auty, Andrew Case, Michael Hale Ligh, Jamie Levy, and AAron Walters. These people volunteer their time and skills to bring you the most advanced and innovative memory forensics framework in the world! If you appreciate the hard work they put into Volatility, I encourage you help defend the rights of open source developers and support developer endorsed events! Finally, shoutz to the Volatility Community for their continued support and feedback! In particular, the following members of the Volatility Community made significant contributions to this release:

    - Cem Gurkok for his work on the privileges plugin for Windows
    - Nir Izraeli for his work on the VMware snapshot address space (see also the vmsnparser project)
    - @osxmem of the volafox project (Mac OS X & BSD Memory Analysis Toolkit)
    - @osxreverser of reverse.put.as for his help with OSX memory analysis
    - Carl Pulley for numerous bug reports, example patches, and plugin testing
    - Andreas Schuster for his work on poison ivy plugins for Windows
    - Joe Sylve for his work on the ARM address space and significant contributions to linux and mac capabilities
    - Philippe Teuwen for his work on the virtual box address space
    - Santiago Vicente for his work on the citadel plugins for Windows

If you want to learn more about Volatility 2.3 or just hang out with the Volatility development team, I encourage you to register for the Open Memory Forensics Workshop 2013.  Please register quickly, we will be ending registration by COB Friday, October 25 (Today). There have been a couple last minute cancellations, so you may still have a chance to reserve a seat!

Thursday, October 10, 2013

Sampling RAM Across the (EnCase) Enterprise

One thing that people may or may not realize is that you can mount memory with EnCase and use Volatility directly against the mounted memory "file". This can be especially useful for checking your enterprise for infected machines in order to narrow your focus. This is a quick post on how to accomplish this.

NOTE: One of the most common questions we receive is how to process memory that has been acquired with EnCase (EWF format). Volatility has an address space to work with EWF format, however it requires the installation of libewf, which some people have trouble installing on Windows. It is worth noting that everything in this blog can be used in order to process memory samples that were acquired or saved in EWF format. These samples must have been saved as "RAM" and not as a disk image, otherwise EnCase will not mount it correctly. (This can happen if a raw sample was reacquired with the incorrect type.)

Accessing RAM

First you need to connect to the machines of interest, either using EnCase Enterprise (EE) or some kind of hybrid approach (OK, if you're using the hybrid approach, you probably don't even need EnCase, unless you are using EnScripts or keyword searching etc). For EE, make sure that you click the "Physical Memory" checkbox before connecting to each of the machines.

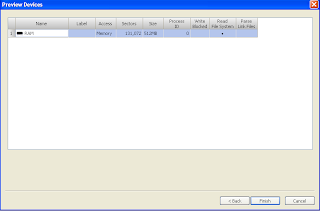
At this point, you should have a list of all the items available from those machines that you can pull back (RAM and Disks). You can choose the items that you want to preview. Below you can see that I have selected one machine's RAM:

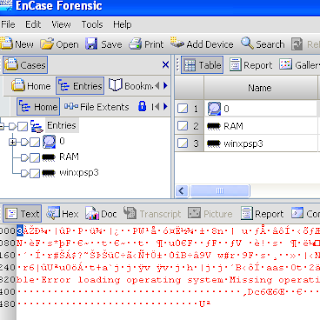
After you have pulled back all devices, you will see them in the pane on the left. Below you can see a disk image and two RAM samples, in this case one from a live machine and one acquired sample. You can, however, pull back several RAM and disk previews with EE. (I'm just giving you an example, since I don't currently have EE with which to create nice screenshots).

Mounting Memory Using VFS

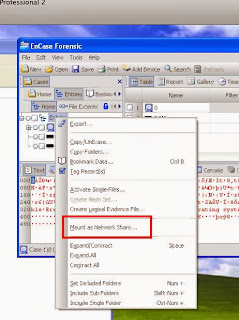
EE or EnCase Forensic (EF) with the VFS/PDE modules (or EF v7) all have the ability to mount disk and RAM in a way that can be accessed by the local machine. This is accomplished through EnCase's Virtual File System (VFS) module. You can mount all RAM samples and disk images from live machines or evidence files as a network share. In order to do so, you have to mount at the case level and not one piece of evidence at a time. To do so, right-click on "Entries" in the left pane and choose "Mount as Network Share..." from the menu:

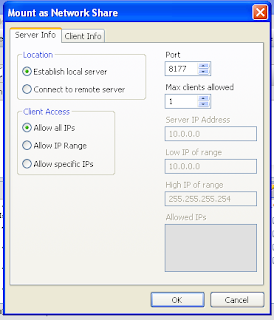
At this point, you will be presented with options for mounting the share. Pick the options most appropriate for you:

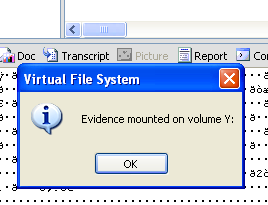
Once you hit "OK" you will see a message box that states where the evidence was mounted:

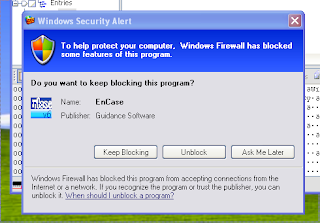
You may or may not receive a warning from Windows firewall, if so, allow EnCase access

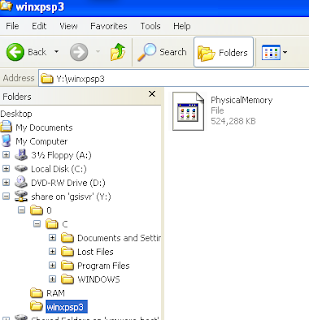
At this point you can explore to the share and process as desired. You can even share out and process with a linux machine if you so wish. If you have mounted several items, they will be contained inside their own separate folder. Disk images will look as you would expect on a Windows system and RAM is exposed as a "file" called "PhysicalMemory".

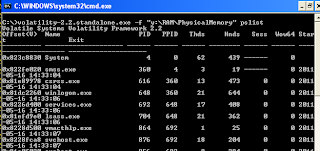
You can run Volatility over this exposed PhysicalMemory file as you would any other memory sample. This can be useful for triage or "sampling" of a machine without having to pull back the entire memory, which can be quite large. Plus you can script out Volatility to run over every memory sample that is mounted at once. The caveat of course is that you are interacting with the machine and therefore changing its state. You might overwrite evidence as you process the memory live. This is something that you have to consider in your IR plan and outside the scope of this tutorial.

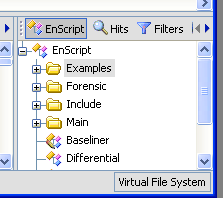
To unmount, simply double-click "Virtual File System" in the bottom right-hand corner and choose "Yes" and "OK".


I hope you have enjoyed this brief tutorial. If you have any questions, feel free to send me an email or find me on twitter (@gleeda).

Monday, September 30, 2013

2014 Malware and Memory Forensics Training Schedule Part 1

After a SOLD OUT class in Amsterdam last month, we are back with the part 1 of our training schedule for 2014. We will be making our first appearance on the west coast of the United States as well as our second appearance in Europe.

* January 20th - 24th in San Diego, CA 
* June 9th - 13th in London, UK

Instructors: Michael Ligh (@iMHLv2), Andrew Case (@attrc), Jamie Levy (@gleeda)

To request a link to the online registration site or to receive a detailed course agenda/outline, please send an email voltraining [[ at ]] memoryanalysis.net.

Please note there is still seating available for our November 2013 class in Reston VA, but that will not last long.

Students in our Amsterdam class wanted to share some feedback with you:
An ultimate course to sharpen your forensic and reverse engineering skills and to get weaponized to track and combat the most sophisticated pieces of malware. - Anthony (Council of the EU) 
The course was exceptional.  The depth and scope of the research conducted by the trainers was remarkable.  The fact that the trainers were able to provide comprehensive answers to any question posed was refreshing. - Vafa (Cisco) 
This course gave me in depth knowledge of memory forensics and windows malware functioning as a starting point for a whole new level of forensic analysis. - Marco (Fox-IT) 
The Volatility training was the best memory fundamentals that exists anywhere.  In the labs they go through many memory images with malware I have see(n) in the wild.  Their practical approach to using malware, memory and disk forensics are excellent. - Anonymous 
This course was enriching on so many levels.  Taught by people who know the tool from every angle.  Presenting interesting reallife challenges and supporting you whenever you are lost.  Best training I've had in years! - Clement (Price Waterhouse Cooper)
This is the only memory forensics course officially designed, sponsored, and taught by the Volatility developers. One of the main reasons we made Volatility open-source is to encourage and facilitate a deeper understanding of how memory analysis works, where the evidence originates, and how to interpret the data collected by the framework's extensive set of plugins. Now you can learn about these benefits first hand from the developers of the most powerful, flexible, and innovative memory forensics tool.

If neither of the announced dates and locations jive with your schedule, keep an eye on our blog for Part 2 of our 2014 training schedule.

Thursday, September 5, 2013

Leveraging CybOX with Volatility

Lately I've been playing around with Cyber Observable eXpression, CybOX, and created a plugin to help check for threat indicators in memory samples. In case you don't know, CybOX provides a vendor neutral format for expressing indicator information. As of late, it has been gaining a lot of momentum among security/forensics vendors and government agencies.  It has python bindings and an extensive schema that supports various disk, network and memory artifacts. There are also scripts available for converting OpenIOC indicators to CybOX format. The project has a lot of potential and the developers are very responsive.  As a result, it has the potential to provide a powerful capability to the Volatility community.  The initial release of the Volatility plugin currently supports the following observable artifacts:
  • Process names
  • IP addresses/domains
  • Mutexes
  • Open(ed) files
  • Services
  • Registry Keys/Values
These artifacts will be expanded as the need arises.

Obtaining Python-CybOX

Make sure to install the dependencies before downloading CybOX. If you are on Mac OSX, you can find newer versions of lxml in macport:
$ port search lxml
[snip]
py-lxml @2.3.2 (python, devel)
    Powerful and Pythonic XML processing library

py24-lxml @2.3.2 (python, devel)
    Powerful and Pythonic XML processing library

py25-lxml @2.3.2 (python, devel)
    Powerful and Pythonic XML processing library

py26-lxml @2.3.2 (python, devel)
    Powerful and Pythonic XML processing library

py27-lxml @2.3.2 (python, devel)
    Powerful and Pythonic XML processing library
Since I'm running Python 2.6, I chose py26-lxml. After getting all the dependencies installed, you can now install CybOX:
$ git clone https://github.com/CybOXProject/python-cybox.git
$ cd python-cybox
$ python setup.py build
$ sudo python setup.py install
If all goes well you shouldn't see any errors and can now use CybOX. You can try to import it to be sure it installed OK:
$ python
Python 2.6.1 (r261:67515, Jun 24 2010, 21:47:49) 
[GCC 4.2.1 (Apple Inc. build 5646)] on darwin
Type "help", "copyright", "credits" or "license" for more information.
>>> import cybox.bindings.cybox_core as core_binding
>>> from cybox.core import Observables
>>>

Obtaining IOCs

Currently, there are not a lot publicly available indicator examples in CybOX format. Granted with support currently being added to both commercial and open source tools and with government agencies looking to distribute their indicators in CybOX format, we expect that to be changing soon. In the meantime and for the sake of testing, let's demonstrate how a vendor specific format like OpenIOC can be converted to CybOX.  There are a few places that one can find IOCs in the OpenIOC format, such as:
Not all of these will be useful from a memory forensics point of view, however, since they mostly cover disk artifacts. After an OpenIOC file is obtained, you can convert them into CybOX format. The conversion script can be found in the CybOX/Tools repository, which is obtainable through github:
$ git clone https://github.com/CybOXProject/Tools.git
$ cd Tools/scripts/openioc_to_cybox/
$ python openioc_to_cybox.py -i [IOC file to convert] -o [output file]
So let's say that we want to convert this OpenIOC file to CybOX format. We'd use the openioc_to_cybox.py script like so:
$ python openioc_to_cybox.py -i 6d2a1b03-b216-4cd8-9a9e-8827af6ebf93.ioc -o 6d2a1b03-b216-4cd8-9a9e-8827af6ebf93.ioc.xml
We can now use the output file 6d2a1b03-b216-4cd8-9a9e-8827af6ebf93.ioc.xml with CybOX

CybOXer: A New Volatility Plugin

We have created a plugin, called cyboxer, that allows users to use CybOX IOCs with Volatility. This plugin has the following options:
  -v, --verbose         Verbose information
  -c CYBOX, --cybox=CYBOX
                        CybOX output file (xml)
  -D DIRECTORY, --directory=DIRECTORY
                        Directory of CybOX xml files

The plugin must have either -c or -D as an option. The -v (verbose) flag prints out more information, including what files/handles/etc were responsive to the CybOX rule. The CybOX files are first parsed in order to obtain all observables and then the plugin enumerates the appropriate memory objects and compares them to the observable values. After this, the plugin parses out the CybOX compositions which contain the logic describing how these observables relate to each other. Supported logic is as follows:
  • Equals
  • Contains
  • DoesNotContain
  • DoesNotEqual
  • StartsWith
  • EndsWith
  • GreaterThan
  • GreaterThanOrEqual
  • LessThan
  • LessThanOrEqual
Other logic will be added at a later date as needed.

Example Usage

For this example, we'll use a CybOX file that was converted from this OpenIOC file against this memory sample:
$ python vol.py -f zeus.vmem cyboxer -c TEST/6d2a1b03-b216-4cd8-9a9e-8827af6ebf93.ioc.xml
Volatile Systems Volatility Framework 2.3_beta
Getting processes...
Getting handles...
Found the following IOC: Finds Zeus variants, twexts, sdra64, ntos
Items found:
    Type: WindowsHandleObjectType, Value: _AVIRA_, Condition: Contains
    Type: ProcessObjectType, Value: winlogon.exe, Condition: Contains
    Type: WindowsHandleObjectType, Value: system32\lowsec\user.ds, Condition: Contains
    Type: WindowsHandleObjectType, Value: system32\sdra64.exe, Condition: Contains
    Type: WindowsHandleObjectType, Value: system32\lowsec\local.ds, Condition: Contains
The "Value" is the value that was given in the CybOX observable. We also see the "Type" of the observable object and the "Condition" (logic) that was used to find the value in memory. If we want to see more information about what was responsive we can use the verbose flag. Additional information includes the Observable ID, if it is a type (File, Mutex etc), a flag indicating whether or not it was found in memory (should be True) and the value of the item that was found in memory that matches the Composition criteria:
$ python vol.py -f zeus.vmem cyboxer -c TEST/6d2a1b03-b216-4cd8-9a9e-8827af6ebf93.ioc.xml -v
Volatile Systems Volatility Framework 2.3_beta
Getting processes...
Getting handles...
Found the following IOC: Finds Zeus variants, twexts, sdra64, ntos
Items found:
    Type: WindowsHandleObjectType, Value: _AVIRA_, Condition: Contains, ID: openioc:indicator-item-e033b865-95ba-44ab-baa5-3b1e8e5f348c, IsType: False, IsFound: True
        Responsive item: \Device\NamedPipe\_AVIRA_2109
        Responsive item: _AVIRA_2109
    Type: ProcessObjectType, Value: winlogon.exe, Condition: Contains, ID: openioc:indicator-item-50455b63-35bf-4efa-9f06-aeba2980f80a, IsType: False, IsFound: True
        Responsive item: winlogon.exe
    Type: WindowsHandleObjectType, Value: system32\lowsec\user.ds, Condition: Contains, ID: openioc:indicator-item-1c3f8902-d4e2-443a-a407-15be3951bef9, IsType: False, IsFound: True
        Responsive item: \Device\HarddiskVolume1\WINDOWS\system32\lowsec\user.ds
    Type: WindowsHandleObjectType, Value: system32\sdra64.exe, Condition: Contains, ID: openioc:indicator-item-c5ae706f-c032-4da7-8acd-4523f1dae9f6, IsType: False, IsFound: True
        Responsive item: \Device\HarddiskVolume1\WINDOWS\system32\sdra64.exe
    Type: WindowsHandleObjectType, Value: system32\lowsec\local.ds, Condition: Contains, ID: openioc:indicator-item-7fab12d1-67ed-4149-b46a-ec50fc622bee, IsType: False, IsFound: True
        Responsive item: \Device\HarddiskVolume1\WINDOWS\system32\lowsec\local.ds

Below we can see an example of cyboxer running against a directory of CybOX xml files
$ python vol.py -f zeus.vmem cyboxer -D TEST
Volatile Systems Volatility Framework 2.3_beta
Getting processes...
Getting opened files...
Getting handles...
Getting services...
Getting connections...
Getting registry keys...
Found the following IOC: This is a sample IOC that will hit on a number different artifacts present on a Windows computer. This IOC is used to test or illustrate the use of an IOC.
Items found:
 Type: FileObjectType, Value: win.ini, Condition: Equals
 Type: WindowsServiceObjectType, Value: ('TrkWks', None, None), Condition: Equals
 Type: FileObjectTypeExt, Value: evt, Condition: Contains
 Type: FileObjectType, Value: sens.dll, Condition: Equals


Found the following IOC: Finds Zeus variants, twexts, sdra64, ntos
Items found:
 Type: WindowsHandleObjectType, Value: _AVIRA_, Condition: Contains
 Type: ProcessObjectType, Value: winlogon.exe, Condition: Contains
 Type: WindowsHandleObjectType, Value: system32\lowsec\user.ds, Condition: Contains
 Type: WindowsHandleObjectType, Value: system32\sdra64.exe, Condition: Contains
 Type: WindowsHandleObjectType, Value: system32\lowsec\local.ds, Condition: Contains
Below is an example of cyboxer running against a flame hibernation file:
$ python vol.py -f hiberfil.sys cyboxer -c TEST/af2e8c80-13db-4a57-99ac-460ccd192333.ioc.xml -v
Volatile Systems Volatility Framework 2.3_beta
Getting processes...
Getting opened files...
Getting handles...
Getting registry keys...
Found the following IOC: IOCs to detect the presence of the Flamer framework
Items found:
 Type: FileObjectType, Value: rccache.dat, Condition: Equals, ID: openioc:indicator-item-a82530a3-2351-4625-a578-fecf9979f735, IsType: False, IsFound: True
  Responsive item: \Device\HarddiskVolume1\Program Files\Common Files\Microsoft Shared\MSSecurityMgr\rccache.dat
 Type: WindowsHandleObjectType, Value: microsoft shared_mssecuritymgr_ssitable, Condition: Contains, ID: openioc:indicator-item-c2b094ad-e353-4433-90cb-4048c62f0ff2, IsType: False, IsFound: True
  Responsive item: c__program files_common files_microsoft shared_mssecuritymgr_ssitable
  Responsive item: c__program files_common files_microsoft shared_mssecuritymgr_ssitable_SHR
 Type: WindowsHandleObjectType, Value: microsoft shared_mssecuritymgr_mscrypt.dat, Condition: Contains, ID: openioc:indicator-item-3be23f29-dc73-4baa-8ad3-4b0cd1c2b6dd, IsType: False, IsFound: True
  Responsive item: c__program files_common files_microsoft shared_mssecuritymgr_mscrypt.dat
  Responsive item: c__program files_common files_microsoft shared_mssecuritymgr_mscrypt.dat_SHR
  Responsive item: c__program files_common files_microsoft shared_mssecuritymgr_mscrypt.datShared
 Type: WindowsHandleObjectType, Value: TH_POOL_SHD_PQOISNG, Condition: Contains, ID: openioc:indicator-item-209070e1-50d7-489d-af11-e0f2b3df23d5, IsType: False, IsFound: True
  Responsive item: TH_POOL_SHD_PQOISNG_912SYNCMTX
  Responsive item: TH_POOL_SHD_PQOISNG_1244SYNCMTX
  Responsive item: TH_POOL_SHD_PQOISNG_1604SYNCMTX

Notes


Only the aforementioned items are supported at this time, however there are plans to expand the plugin sometime in the future. Unsupported items are currently ignored and have no affect on the composition logic. Only items that are found are printed out. Items that have "DoesNotEqual" and "DoesNotContain" are not printed, since they are often used in combination with other observable values (this may change sometime in the future, however). Also file objects are always evaluated as "Contains" when "Equals" has been given as a condition. This is because in memory these file objects have the entire kernel path (\Device\HarddiskVolume1\...) which will never match something like "rccache.dat" alone.

Conclusion


This plugin is still under development, but we hope that you will find this plugin useful in your investigations. I would like to thank Ivan Kirillov, Greg Back and the rest of the CybOX team for maintaining this project and for their help and support. If you are interested in testing this plugin, please drop me a line at jamie.levy {at} gmail {dot} com.

Wednesday, August 21, 2013

Results are in for the 1st Annual Volatility Framework Plugin Contest!

We are excited to announce the results of the 1st Annual Volatility Plugin Contest. We were pleasantly surprised with 8 submissions to the contest. Each submission provides an exciting new capability to the memory analysis community or demonstrates the power of Volatility to solve a variety of real world problems. The submissions included everything from new plugins to new address spaces and operating system plugins to application plugins.  We also had submissions for Linux, Windows, and OS X. It's great to see so many people giving back to the memory analysis community and taking this opportunity to do pioneering research in such an exciting field.

Given the number of deserving submissions we received, the judging took a little longer than we originally anticipated. We wanted to make sure that we were able to thoroughly test and verify each submission. We would like to thank all the participants for their submissions. A number of these submissions will be highlighted in upcoming blog posts and at OMFW 2013!

The winners of the 1st Annual Volatility Framework Plugin Contest are:
  1. Mariano Graziano from EURECOM with Actaeon, Intel VT-x introspection.
  2. Cem Gurkok with OS X rootkit detection and Window's security auditing plugins.
  3. Jeff Bryner with the Facebook and Twitter artifact extraction.
  4. Carl Pulley with a plugin to find the nearest function/method within a symbol table & Edwin Smulders with his Linux process information, stack analysis, and syscall register plugins [Note: Carl and Edwin tied for 4th place, this is not a joint submission]
  5. Jamaal Speights with extracting networking packets from memory samples.
Honorable Mention: Jeremy Jones from Delphix with a plugin to convert VMware suspended state to Illumos debug format

1st Place 


Mariano Graziano from EURECOM with Actaeon, Intel VT-x introspection.
Description:
This submission enables memory forensics of guest operating systems in virtualization environments using Intel VT-x technology. This includes the ability to locate memory resident hypervisors and nested virtualization.  It's current implementation enables virtual machine instrospection of 32-bit Windows guests. It was tested with KVM, Xen, VMware Workstation, VirtualBox and HyperDbg.
Download Link:
downloads.volatilityfoundation.org/contest/2013/MarianoGraziano_Actaeon.zip
Related Links:
http://www.s3.eurecom.fr/tools/actaeon/
https://github.com/eurecom-s3/actaeon
http://www.s3.eurecom.fr/docs/raid13_graziano.pdf
Author's Twitter: @emd3l

2nd Place 


Cem Gurkok with the Window's security permission plugin
Description:
This plugin displays the security permission information for files, processes, services, tokens, threads, devices, and registry keys. The information includes DACLs, SACLs (Discretionary/System access control lists), object integrity level, and object ownership. Security permission information is obtained from the object’s security descriptor. This plugin can help administrators proactively assess the security of their systems and can also help determine possible "holes" that led to successful privilege escalation attacks. This plugin dumps verbose information that you can categorize and filter for your needs, and it also supports all major 32-bit and 64-bit Windows operating systems.
Download Link:
downloads.volatilityfoundation.org/contest/2013/CemGurkok_WindowsSecurity.zip
Author's Twitter: @CGurkok

Cem Gurkok with the OS X rootkit detection plugins
Description:
This submission provides detection capabilities for a number of rootkit hooking techniques within 64 bit OS X:
  • Direct syscall table modification
  • Syscall function inlining (ie DTrace hooks)
  • Patching the syscall handler (ie, shadow sycall table)
  • Hooked functions in kernel/kext symbol tables
  • Modified IDT descriptors
  • Modified IDT handlers
There is published research and example rootkits that are leveraging the exact hooking techniques detected by this plugin, and the addition of the plugin into the core framework will greatly enhance Volatility's Mac rootkit detection capabilities.
Download Link:
downloads.volatilityfoundation.org/contest/2013/CemGurkok_OSXDetect.zip
Related Links:
http://siliconblade.blogspot.com/2013/07/idt-hooks-and-detecting-them-in-osx.html
http://siliconblade.blogspot.com/2013/07/back-to-defense-finding-hooks-in-os-x.html
http://siliconblade.blogspot.com/2013/07/offensive-volatility-messing-with-os-x.html
http://siliconblade.blogspot.com/2013/05/checkdtrace-volatility-plugin-arises.html
Author's Twitter: @CGurkok

3rd Place 


Jeff Bryner with the Facebook and Twitter artifact extraction
Description:
This submission provides plugins for carving Twitter and Facebook artifacts from a process' address space.  This is accomplished by scanning the address space for the json/html structures that are used by the social media applications.  Examples of information extracted include: Twitter direct messages, identifying user information, Facebook direct messages, etc.
Download Link:
downloads.volatilityfoundation.org/contest/2013/JeffBryner_FacebookTwitter.zip
Related Links:
https://github.com/jeffbryner/volatilityPlugins
http://www.youtube.com/watch?v=K_gBpdK936o
Author's Twitter: @0x7eff

4th Place (tie)


Carl Pulley with a plugin to find the nearest function/method within a symbol table.

Description:
This submission demonstrates the usefulness of being able to dynamically extract Window's symbol information.  It includes a plugin that will automatically extract symbol information from PDB files associated with memory resident modules.   The submission also includes a "profile modification" that creates a new member of the _EPROCESS object, which facilitates "nearest symbol" lookups of addresses. This can be very useful when investigating unknown pointers or the control flow history of a corrupted execution stack.
Download Link:
downloads.volatilityfoundation.org/contest/2013/CarlPulley_Symbols.zip
Related Links:
https://github.com/carlpulley/volatility/blob/master/symbols.py
https://code.google.com/p/pdbparse/issues/detail?id=13
Author's Githubhttps://github.com/carlpulley

Edwin Smulders with his Linux process information, stack analysis, and syscall register plugins
Description:
This submission provides plugins for extracting information from x86_64 Linux memory samples. They provide extensive insight into the state of the system at the time of the memory samples. Examples of the extracted information include:
  • Detailed process information
  • Networking data structures
  • Detailed analysis and annotation of the execution stacks
  • System call context
Download Link:
downloads.volatilityfoundation.org/contest/2013/EdwinSmulders_Symbols.zip
Related Links:
https://github.com/Dutchy-/volatility-plugins
Author's Twitter: @0x445554434859

5th Place 


Jamaal Speights with a plugin that extracts networking packets from memory samples.
Description:
The ethscan plugin provides the ability to recover Ethernet frames from memory samples. It provides extraction support for both IPV4 and IPV6. It also provides the option to extract the frame data to either binary files or to a pcap file. It should work against any binary file (not just memory dumps).
Download Link:
downloads.volatilityfoundation.org/contest/2013/JamaalSpeights_Network.zip
Related Links:
https://code.google.com/p/jamaal-re-tools/source/browse/volplugins/ethscan.py
Author's Twitter: @jamaalspeights

Honorable Mention


Jeremy Jones from Delphix with a plugin to convert VMware suspended state to Illumos debug format
Description:
This submission includes a plugin that converts a VMware suspended state file (.vmss) into a format supported by Illumos debugging tools (mdb, adb, etc.). It was tested on an OpenIndiana VM, which it converted successfully and whose files worked well when anaylzed with mdb. This plugin was created to solve a real world system administration challenge of collecting a crash dump from a system that was hanging during the boot process. It demonstrates the power of memory analysis beyond just forensics and security.
Download Link:
downloads.volatilityfoundation.org/contest/2013/JeremyJones_Illumos.zip


The Volatility Foundation would like to thank everyone who participated in this year's contest. Memory analysis is one of the most exciting and important fields in information security and digital forensics. It requires a deep technical skill set and an investigative mindset that are often rare to find. The participants in the plugin contest were not only competing for prizes but they were also contributing pioneering research that will help shape the future of the field. While this page highlighted research that was officially submitted to the contest, there were also a few other efforts worth mentioning: a new Xen address space written by Nehal Bandi from Citrix Systems and patches to mftparser and timeliner that facilitate including memory artifacts into Plaso and log2timeline by David Nides and Kristinn Gudjonsson.

If you have any questions about a particular submission, please contact the participant directly.

Tuesday, June 25, 2013

Memory Forensics Training - Reston, VA - November 2013

The next journey to the center of Windows Memory Forensics starts in Reston, VA this November!

This event will be the 5th public offering of the Windows Malware and Memory Forensics Training by The Volatility Project. This is the only memory forensics course officially designed, sponsored, and taught by the Volatility developers. One of the main reasons we made Volatility open-source is to encourage and facilitate a deeper understanding of how memory analysis works, where the evidence originates, and how to interpret the data collected by the framework's extensive set of plugins. Now you can learn about these benefits first hand from the developers of the most powerful, flexible, and innovative memory forensics tool.

Dates: Monday, November 11th through Friday, November 15th 2013
Location: Reston, VA (exact location will be shared upon registration)
Instructors: Michael Ligh (@iMHLv2), Andrew Case (@attrc), Jamie Levy (@gleeda)

For more information about the course, view the Volatility Training Flyer (to download a copy of the PDF, click File > Download). To request a link to the online registration site or to receive a detailed course agenda/outline, please send an email voltraining [[ at ]] memoryanalysis.net.

Curious what our past attendees have been saying about the class? Here are some testimonials from our recent class in Reston:
"One of the best technical classes I've taken in 10 years" - Rich M. (HP)
"Excellent memory forensics training. Definitely would recommend it to anyone in DFIR or malware analysis" - Q.M. (McAfee) 
"Realistic labs and the one-on-one instruction make the entire class worth it. Everything else is icing" - Anonymous 
"Super technical and awesome" - Sarah E. (Harris)
"Best forensic and winternal training I've ever experienced. Raises the bar really high" - Lance B.
"This is as valuable an education as any of you have had in your career" - Ash K. (Intersections)
"Great, great course. Most malware classes out there walk through analysis of some IRC bot from the 90's and call it good. This was an excellent trip into modern, highly sophisticated malware and gave real methodologies to quickly analyze them" - Brian H. (Harris)

Thursday, June 20, 2013

The Perfect Combination of IR, Malware, Forensics, and Winternals

Our Windows Malware and Memory Forensics training course has been described as the "...perfect combination of incident response, malware analysis, memory forensics, and Windows internals." As you can see below, we do in fact disseminate quite a bit of information. If you're used to instructors dropping knowledge bombs, we parade you with missiles. Not literally of course, you will leave with in one piece - we promise.


The next opportunity to join us in the journey to the center of memory forensics is September 9-13th in Amsterdam, The Netherlands and then November 11-14th in Reston Virginia. Email us at voltraining [[ @ ]] memoryanalysis.net for a full course outline or a registration invite to either of our upcoming events. We have no doubt you'll enjoy the course as much as our students did last week:
"Excellent memory forensics training. Definitely would recommend it to anyone in DFIR or malware analysis" - Q.M. (McAfee) 
"Realistic labs and the one-on-one instruction make the entire class worth it. Everything else is icing" - Anonymous  
"One of the best technical classes I've taken in 10 years" - Rich M. (HP) 
"Best memory forensics class and tool in the business" - Brian R. (Harris) 
"This course was invaluable for the hands-on experience dissecting real-world malware from memory dumps. Terrific, would absolutely recommend it to anyone in the security field" - Marco C. 
"Huge props to the entire Volatility team for the amazing DFIR work they do and excellent training" - Kyle O. (GE) 
"The Volatility Team crammed a years worth of answers into one week - they are fantastic" - Tim R. (Intersections)  
"Best forensic and winternal training I've ever experienced. Raises the bar really high" - Lance B. 
"Super technical and awesome" - Sarah E. (Harris) 
"In the past I've avoided forensics because it seemed tedious and slightly boring...this class has completely changed my perspective" - Chris T. (Booz Allen) 
"I was amazed at the amount of artifacts that could be obtained from memory dumps through the use of the Volatility Framework" - Scott H.  
"This is as valuable an education as any of you have had in your career" - Ash K. (Intersections) 
"The best technical course I've ever attended. Many practical labs, technical info...simply love it" - Salah. A. (KACST) 
"The lab exercises were fantastic; technically challenging and true to life. I really enjoyed the class" - Christopher G.  
"Great, great course. Most malware classes out there walk through analysis of some IRC bot from the 90's and call it good. This was an excellent trip into modern, highly sophisticated malware and gave real methodologies to quickly analyze them" - Brian H. (Harris)  
"This was the most relevant hands-on DFIR training I've ever had. The topics covered in class are a must for anyone tasked with enterprise security" - William P. (GE) 
"Spending a week learning from the Volatility creators is worth every penny. The course is well designed and presented and will help me in my role at work immediately" - Akira M.  
"Mind blowing crash course in Windows internals, malware research, and Volatility packed in just five days" - Marc R.  
"Tons of well presented information on Windows internals and how they relate to memory forensics. Lots of hands-on" - Ron H. (Dell Secureworks) 
"Everything you ever wanted to know about Windows memory forensics and beyond. A must take for any incident responder" - Mark P. (NIH) 
"This is an amazing course that will not only provide the skills and knowledge you need to run Volatility, but also give you a much deeper insight into Windows memory internals" - Dave L.  
"This is much more than a class on how to use a tool. By far the best training I've attended in several years. Instructors are top notch. Excellent class for even the most experienced of analysts" - Adam W.  
"Definitely the most advanced forensics course that one can imagine. I believe that it attempts the impossible - of actually giving a complete overview and state-of-the-art knowledge about memory forensics" - Greg I. (E & Y) 
"Best DFIR course there is" - John P. 

Tuesday, June 11, 2013

MOVP II - 4.5 - Mac Volatility vs the Rubilyn Kernel Rootkit

In our final Month of Volatility Plugins post, we are going to demonstrate a number of plugins that can be used to detect kernel level OS X rootkits. To show these capabilities I am going to analyze a system that is infected with the rubilyn rootkit. I want to thank @osxreverser for providing me with the infected memory sample that I did this analysis on.

Rubilyn

This rootkit was released on full disclosure last year, and claimed the following capabilities:


* works across multiple kernel versions (tested 11.0.0+)
* give root privileges to pid
* hide files / folders
* hide a process
* hide a user from 'who'/'w'
* hide a network port from netstat
* sysctl interface for userland control
* execute a binary with root privileges via magic ICMP ping 
 
The release notes claim to use system call hooking and DKOM to accomplish these goals. 

Detecting Hidden Processes

The first capability of Rubilyn that we will detect is the hiding of processes. If we run the mac_psxview plugin on our infected image, we immediately see a suspicious process:

$ python vol.py -f rubilyn.vmem --profile=MacLion_10_7_5_AMDx64 mac_psxview
Volatile Systems Volatility Framework 2.3_beta
Offset(P)          Name                    PID pslist parents pid_hash pgrp_hash_table session leaders task processes
------------------ -------------------- ------ ------ ------- -------- --------------- --------------- --------------
0xffffff80008d8d40 kernel_task               0 True   True    False    True            True            True
0xffffff8005ee4b80 launchd                   1 False  True    True     True            True            True
0xffffff8005ee4300 kextd                    10 True   True    True     True            True            True
0xffffff8005ee3ec0 UserEventAgent           11 True   False   True     True            True            True
0xffffff8005ee3640 notifyd                  12 True   False   True     True            True            True
0xffffff8005ee3200 mDNSResponder            13 True   False   True     True            True            True
0xffffff8005ee2dc0 opendirectoryd           14 True   False   True     True            True            True
0xffffff8005ee2980 diskarbitrationd         15 True   False   True     True            True            True
0xffffff8005ee2540 configd                  16 True   False   True     True            True            True
0xffffff8005ee2100 syslogd                  17 True   False   True     True            True            True

The launchd process of PID 1, appears in all columns but 'pslist'. This shows us that the rootkit was used to hide the particular process from the kernel's process list. In a real investigation this would be a process related to the attacker's activity (network listener, keylogger, etc), and we could then immediately focus our investigation on it. See our previous post from this week, MOVP 3.2 - Dumping, Scanning, and Searching Mac OSX Process Memory, to learn how to investigate individual processes.

System Call Hooking

Since the documentation claims to use system call hooking, it makes sense to check this. Volatility's mac_check_syscalls is able to determine hooks to the system call table and print the address of the hook. This reveals three hooked system calls:

$ python vol.py -f rubilyn.vmem --profile=MacLion_10_7_5_AMDx64 mac_check_syscalls | grep HOOK
Volatile Systems Volatility Framework 2.3_beta
SyscallTable       222 0xffffff7f807ff41d HOOKED
SyscallTable       344 0xffffff7f807ff2ee HOOKED
SyscallTable       397 0xffffff7f807ffa7e HOOKED

Looking up the system call table indexes for entries 222, 344, and 397 reveal that getdirentriesattr, getdirentries64, and write_nocancel are hooked. getdentires (get directory entries) are calls involved with reading of directories from active filesystems. These are almost always used to hide files and directories.

Reading the source code of the write_nocancel hook shows that it is looking for processes named 'grep', 'who', and 'netstat', and then filters out entries related to the rootkit. This will effectively hide data from these userland tools.

Custom Sysctl Handlers  

Rubilyn loads a kernel module, and if we use the mac_lsmod plugin, we see it listed as the first entry (note: modules are stored in the reverse order of when they loaded).

$ python vol.py -f rubilyn.vmem --profile=MacLion_10_7_5_AMDx64 mac_lsmod
Address                          Size   Refs   Version      Name
------------------ ------------------ -------- ------------ ----
0xffffff7f807fe000             0x5000    0     1            com.hackerfantastic.rubilyn
0xffffff7f8159d000             0xa000    0     0081.82.01   com.vmware.kext.vmhgfs
0xffffff7f80ad3000             0x6000    0     5.1.0        com.apple.driver.AppleUSBMergeNub
0xffffff7f80a7a000             0x8000    0     5.0.0        com.apple.iokit.IOUSBHIDDriver
0xffffff7f80a82000             0x6000    1     5.0.0        com.apple.driver.AppleUSBComposite

The mac_check_sysctl plugin lists all active sysctl entries and their handlers, and prints "OK" if the handler points to a known address within the kernel or a kernel module or prints "HOOKED" if is not found in these places.

In the case of Rubilyn, its handlers will be listed, but marked "OK" as the kernel module is still in the module list. Since we know the rootkit is malicious, we have two choices:

1) filter out the module in mac_lsmod so it appears hidden to other plugins
2) leverage mac_volshell to print out the sysctl handlers inside the module

Since 1) is fairly straightforward and many people have never used mac_volshell, I chose to do 2).

$ python vol.py -f rubilyn.vmem --profile=MacLion_10_7_5_AMDx64 mac_volshell
Volatile Systems Volatility Framework 2.3_beta
Current context: process kernel_task, pid=0 DTB=0x100000
Welcome to volshell! Current memory image is:
file:///root/vol2.3/rubilyn.vmem
To get help, type 'hh()'
>>> import volatility.plugins.mac.check_sysctl as check_sysctl
>>> for (sysctl, name, val, _) in check_sysctl.mac_check_sysctl(self._config).calculate():
...     handler = sysctl.oid_handler
...     if 0xffffff7f807fe000 <= handler < 0xffffff7f807fe000+0x5000:
...         print "name: %s val: %s handler: %x" % (name, str(val), handler)
...
name: pid2 val: 0 handler: ffffff7f807ff14b
name: pid3 val: 0 handler: ffffff7f807ff1ed
name: dir val:  handler: ffffff7f807ff2aa
name: cmd val:  handler: ffffff7f807ff2bb
name: user val:  handler: ffffff7f807ff2cc
name: port val:  handler: ffffff7f807ff2dd
>>> dis(0xffffff7f807ff14b, 32)
0xffffff7f807ff14b 55                               PUSH RBP
0xffffff7f807ff14c 4889e5                           MOV RBP, RSP
0xffffff7f807ff14f 4157                             PUSH R15
0xffffff7f807ff151 4156                             PUSH R14
0xffffff7f807ff153 4154                             PUSH R12
0xffffff7f807ff155 53                               PUSH RBX
0xffffff7f807ff156 8b5720                           MOV EDX, [RDI+0x20]
0xffffff7f807ff159 488b7718                         MOV RSI, [RDI+0x18]
0xffffff7f807ff15d e8fea3d57f                       CALL 0xffffff8000559560
>>> dis(0xffffff7f807ff1ed, 32)
0xffffff7f807ff1ed 55                               PUSH RBP
0xffffff7f807ff1ee 4889e5                           MOV RBP, RSP
0xffffff7f807ff1f1 4157                             PUSH R15
0xffffff7f807ff1f3 4156                             PUSH R14
0xffffff7f807ff1f5 4155                             PUSH R13
0xffffff7f807ff1f7 4154                             PUSH R12
0xffffff7f807ff1f9 53                               PUSH RBX
0xffffff7f807ff1fa 50                               PUSH RAX
0xffffff7f807ff1fb 8b5720                           MOV EDX, [RDI+0x20]

In this output you can see that I import the mac_check_sysctl plugin. I then use it to enumerate every sysctl, and the generator gives me the sysctl structure, the name of entry, and the current value. I then use the information given from mac_lsmod about the Rubilyn module to filter out entries only belonging to the module. Since we have the handler address of each systcl handler, we could then reverse engineer the handler to see what it does (the 'dis' command).

The names of the discovered sysctl values seem to relate to the capabilities -- hiding ports & processes, running commands, and so on.

IP Filters 

The mac_ip_filters plugin lists any IP filters actived within the kernel. On a default system, there will be no output from this plugin.  It is likely that software firewalls will use this infrastructure to filter packets although we have not fully tested any. During our analysis of the rootkit, we see that it installs a handler for both incoming and outgoing packets:

# python vol.py -f rubilyn.vmem --profile=MacLion_10_7_5_AMDx64 mac_ip_filters
Volatile Systems Volatility Framework 2.3_beta
Context    Filter           Pointer            Status
---------- ---------------- ------------------ ------
INPUT      rubilyn          0xffffff7f807ff577 OK
OUTPUT     rubilyn          0xffffff7f807ff5ff OK
DETACH     rubilyn          0xffffff7f807ff607 OK

Analysis of the INPUT handler shows that it is used to implement an ICMP-based command & control backdoor. The OUTPUT and DETACH are stubs.

Escalation of Process Privleges  

The only capability not detected so far is the escalation of privileges of userland processes. The current version of Volatility is not able to detect this directly on Mac systems as we can on Linux. There are a number of indirect ways to detect this, such as bash history, strings/grep, and others, but those are not something that would be implemented as a plugin. Adding this capability to the next release of Volatility after 2.3 is on the TODO list.

Even with the current release of Volatility it would be hard for rootkits to hide this activity. Process privilege escalation is generally used when the rootkit lives long term in the kernel, but the attacker sparsely uses the infected machine. Upon logging into the system through an SSH or other backdoor, the attacker can then communicate with the kernel rootkit to elevate privileges, and the rouge communication channels (sysctl, system call table, etc) can be detected by Volatility.

Conclusion

We have demonstrated a number of ways to detect the Rubilyn kernel rootkit. The techniques shown will detect a wide range of other rootkits as well as there are only so many places that rootkits can utilize to accomplish their goals.

Sunday, June 9, 2013

MOVP II - 4.4 - What's in Your Mac OSX Kernel Memory?

Today's post will discuss a number of plugins that can retrieve forensically interesting information from within the kernel. Keep in mind, you can also use mac_yarascan to search kernel memory with yara signatures and you can use mac_volshell as an interactive tool to print kernel data structures, display kernel memory addresses as bytes, dword, qwords, or disassemble code in kernel space.

mac_lsmod

This plugin lists the loaded kernel extensions, their base addresses and size, reference count, and version number.

Note: The last several entries in the output of this plugin will likely have no base address and size. These represent the 'dummy' drivers that Mac loads as the system startup and do not correspond to real kernel modules.

$ python vol.py --profile=MacMountainLion_10_8_3_AMDx64 -f ~/10.8.3.mmr.macho mac_lsmod
Volatile Systems Volatility Framework 2.3_alpha
Address                          Size   Refs   Version      Name
------------------ ------------------ -------- ------------ ----
0xffffff7f91847000             0x3000    0     3.0.2        com.atc-nycorp.devmem.kext
0xffffff7f91841000             0x6000    0     10.1.24      com.vmware.kext.vmioplug.10.1.24
0xffffff7f91834000             0xd000    0     0104.03.86   com.vmware.kext.vmx86
0xffffff7f9182a000             0xa000    0     0104.03.86   com.vmware.kext.vmnet
0xffffff7f9181a000            0x10000    0     90.4.23      com.vmware.kext.vsockets
0xffffff7f91808000            0x12000    1     90.4.18      com.vmware.kext.vmci
0xffffff7f916d2000             0xe000    0     75.19        com.apple.driver.AppleBluetoothMultitouch
[snip]

mac_mount

This plugin shows the mounted file systems, which is particularly useful when external media is plugged on or network shares are mounted.

$ python vol.py --profile=MacMountainLion_10_8_3_AMDx64 -f ~/10.8.3.mmr.macho mac_mount
Volatile Systems Volatility Framework 2.3_alpha
Device                         Mount Point                                                  Type
------------------------------ ------------------------------------------------------------ ----
/                              /dev/disk3                                                   hfs
/dev                           devfs                                                        devfs
/net                           map -hosts                                                   autofs
/home                          map auto_home                                                autofs
/Volumes/LaCie                 /dev/disk2s2                                                 hfs

mac_list_sessions

This plugin enumerates sessions from the session hash table. You can use this information to link processes to user names.

$ python vol.py --profile=MacMountainLion_10_8_3_AMDx64 -f ~/10.8.3.mmr.macho mac_list_sessions
Volatile Systems Volatility Framework 2.3_alpha
Leader (Pid) Leader (Name)        Login Name               
------------ -------------------- -------------------------
           0 kernel_task                                   
         257 apsd                 _softwareupdate          
           1 launchd              _securityagent           
          -1      mike              
          11 UserEventAgent       root                     
          12 kextd                root                     
          14 notifyd              root                     
          15 securityd            root                     
          16 diskarbitrationd     root     
[snip]

mac_dmesg

This plugin recovers the kernel debug buffer, which can contain a wide range of system activity, such as device insertion, hardware configurations, wireless activity, and more.

$ python vol.py --profile=MacMountainLion_10_8_3_AMDx64 -f ~/10.8.3.mmr.macho mac_dmesg
Volatile Systems Volatility Framework 2.3_alpha
deny mach-lookup com.apple.coresymbolicationd
MacAuthEvent en1   Auth result for: 00:26:bb:77:d2:a7  MAC AUTH succeeded
wlEvent: en1 en1 Link UP virtIf = 0
AirPort: RSN handshake complete on en1
wl0: Roamed or switched channel, reason #8, bssid 00:26:bb:77:d2:a7
en1: BSSID changed to 00:26:bb:77:d2:a7
en1::IO80211Interface::postMessage bssid changed
MacAuthEvent en1   Auth result for: 00:26:bb:77:d2:a7  MAC AUTH succeeded
wlEvent: en1 en1 Link UP virtIf = 0
AirPort: RSN handshake complete on en1
[snip]

mac_list_zones

This plugin enumerates Mac zones, which are very similar to Linux kmem_cache backed structures. You can use it to determine how many of a particular type of structure (i.e. a process object) are active and freed. For example, below you can see that 133 proc structures are active on the system. Other plugins can inherit from mac_list_zones and actually collect the addresses of each active object type, leading to a wealthy source of information regarding where to find allocated objects in memory dumps.

$ python vol.py --profile=MacMountainLion_10_8_3_AMDx64 -f ~/10.8.3.mmr.macho mac_list_zones
Volatile Systems Volatility Framework 2.3_alpha
Name                           Active Count Free Count Element Size
------------------------------ ------------ ---------- ------------
zones                                   182          0          592
vm.objects                           153401    8832498          224
vm.object.hash.entries               135206     882875           40
maps                                    149      34033          232
VM.map.entries                        26463   24372727           80
Reserved.VM.map.entries                  35      13164           80
VM.map.copies                             0     220097           80
pmap                                    139       7962          256
pagetable.anchors                       139       7962         4096
proc                                    133       4042         1120

mac_dead_procs

This plugin prints terminated/dead processes that it gathers by leveraging the zone enumeration API. In most cases, the UID, GID, PGID, Bits, and DTB columns will show invalid data since we could be looking at partially overwritten data structures. Also please note in some rare cases, active processes are also found in this list. We are currently investigating conditions that lead to active processes showing up in the freed process object list.  We believe the cause is related to the same issue that affects mac_pslist (see the mac_pslist discussion in MoVP II - 4.1 - Leveraging Process Cross-View Analysis for Mac Rootkit Detection).
 
$ python vol.py --profile=MacMountainLion_10_8_3_AMDx64 -f ~/10.8.3.mmr.macho mac_dead_procs
Volatile Systems Volatility Framework 2.3_alpha
Offset             Name                 Pid      Uid      Gid      PGID     Bits         DTB                Start Time
------------------ -------------------- -------- -------- -------- -------- ------------ ------------------ ----------
0xffffff8036349760 diskmanagementd      4158     -        -        -55...11              ------------------ 2013-03-29 12:14:31 UTC+0000
0xffffff8032c60d20 lssave               4161     -        -        -55...11              ------------------ 2013-03-29 12:14:43 UTC+0000
0xffffff803dfe08e0 com.apple.audio.     4146     -        -        -55...11              ------------------ 2013-03-29 12:12:59 UTC+0000
0xffffff803dfe0d40 com.apple.audio.     4145     -        -        -55...11              ------------------ 2013-03-29 12:12:59 UTC+0000
0xffffff8032c62300 com.apple.qtkits     4147     -        -        -55...11              ------------------ 2013-03-29 12:12:59 UTC+0000
[snip] 

Conclusion

In this post we have highlighted several plugins that can be useful in a number of investigative scenarios. Tomorrow we will look at a wide range of plugins as we analyze and detect the rubilyn kernel rootkit in memory.

Friday, June 7, 2013

MoVP II - 4.3 - Recovering Mac OS X Network Information from Memory

The 2.3 release of Volatility will contain four plugins that are capable of recovering networking information from Mac samples. Combined, these plugins allow for deep inspection of system network activity and can be used in conjunction with network forensics.

mac_arp

This plugin prints the ARP table, including sent/recv statistics, time the entry was created, and its expiration.

$ python vol.py --profile=MacMountainLion_10_8_3_AMDx64 -f ~/10.8.3.mmr.macho mac_arp
Volatile Systems Volatility Framework 2.3_alpha
Source IP                Dest. IP                    Name           Sent               Recv                     Time                 Exp.    Delta
------------------------ ------------------------ ---------- ------------------ ------------------ ------------------------------ ---------- -----
192.168.228.255          ff:ff:ff:ff:ff:ff          vmnet8           10                 0           2013-03-29 12:13:59 UTC+0000    39913    0
172.16.244.255           ff:ff:ff:ff:ff:ff          vmnet1           10                 0           2013-03-29 12:13:59 UTC+0000    39913    0
10.0.1.255               ff:ff:ff:ff:ff:ff           en1             12                 0           2013-03-29 12:13:59 UTC+0000    39913    0
10.0.1.8                 e8:8d:28:cb:67:07           en1             19                924          2013-03-29 11:56:30 UTC+0000    40065    1201
10.0.1.2                 ac:16:2d:32:fc:d7           en1             1                  47          2013-03-29 11:56:02 UTC+0000    40037    1201
10.0.1.1                 00:26:bb:6c:8e:64           en1            4551               4517         2013-03-29 01:08:53 UTC+0000    40318    40310

This information is very useful when tracking lateral movement as systems that the investigated computer interacted with can be determined.

mac_ifconfig

mac_ifconfig prints each interface on the system as well its IP addresses.

$ python vol.py --profile=MacMountainLion_10_8_3_AMDx64 -f ~/10.8.3.mmr.macho mac_ifconfig
Volatile Systems Volatility Framework 2.3_alpha
Interface  Address
---------- -------
lo0        fe80:1::1
lo0        127.0.0.1
lo0        ::1
gif0       
stf0       
en1        8c:2d:aa:41:1e:3b
en1        fe80:4::8e2d:aaff:fe41:1e3b
en1        10.0.1.3
en0        10:dd:b1:9f:d5:ce
p2p0       0e:2d:aa:41:1e:3b
fw0        00:0a:27:02:00:4b:19:5c
vmnet1     00:50:56:c0:00:01
vmnet1     172.16.244.1
vmnet8     00:50:56:c0:00:08
vmnet8     192.168.228.1

mac_netstat

The netstat plugin prints each active connection on a system along with its state. Analysis of listening sockets can reveal backdoors and established connections reveal remote connections.
 
$ python vol.py --profile=MacMountainLion_10_8_3_AMDx64 -f ~/10.8.3.mmr.macho mac_netstat
Volatile Systems Volatility Framework 2.3_alpha
UNIX -
UNIX /var/tmp/launchd/sock
UNIX -
UNIX /var/tmp/com.barebones.authd.socket
UNIX /var/run/com.apple.ActivityMonitor.socket
TCP :::548 :::0 TIME_WAIT
TCP 0.0.0.0:548 0.0.0.0:0 TIME_WAIT
UDP 127.0.0.1:60762 0.0.0.0:0 
UNIX /var/run/mDNSResponder
UNIX /var/rpc/ncacn_np/lsarpc
UNIX /var/rpc/ncalrpc/lsarpc
TCP 10.0.1.3:49179 173.194.76.125:5222 TIME_WAIT
TCP 10.0.1.3:49188 205.188.248.150:443 TIME_WAIT
TCP 10.0.1.3:49189 205.188.254.208:443 TIME_WAIT
TCP 10.0.1.3:50614 205.188.13.76:443 TIME_WAIT
UDP 0.0.0.0:137 0.0.0.0:0 
UDP 0.0.0.0:138 0.0.0.0:0 
UNIX /var/run/vpncontrol.sock
UNIX /var/run/portmap.socket
TCP :::5900 :::0 TIME_WAIT
[snip]

mac_route

The mac_route plugin prints the system's routing table. It also prints the number of packets sent and received on each route. This can especially useful during internal network breach investigations.

$ python vol.py --profile=MacMountainLion_10_8_3_AMDx64 -f ~/10.8.3.mmr.macho mac_route
Volatile Systems Volatility Framework 2.3_alpha
Source IP                Dest. IP                    Name           Sent               Recv                     Time                 Exp.    Delta
------------------------ ------------------------ ---------- ------------------ ------------------ ------------------------------ ---------- -----
0.0.0.0                  10.0.1.1                    en1            4342              50431         2013-03-29 01:08:55 UTC+0000      0      0
10.0.1.0                                             en1            8331              31691         2013-03-29 01:08:56 UTC+0000      8      0
10.0.1.1                 00:26:bb:6c:8e:64           en1            4551               4517         2013-03-29 01:08:53 UTC+0000    40318    40310
10.0.1.2                 ac:16:2d:32:fc:d7           en1             1                  47          2013-03-29 11:56:02 UTC+0000    40037    1201
10.0.1.3                 127.0.0.1                   lo0             0                 6168         2013-03-29 01:08:55 UTC+0000      0      0
10.0.1.8                 e8:8d:28:cb:67:07           en1             19                924          2013-03-29 11:56:30 UTC+0000    40065    1201
10.0.1.255               ff:ff:ff:ff:ff:ff           en1             12                 0           2013-03-29 12:13:59 UTC+0000    39913    0
17.171.4.15              10.0.1.1                    en1             39                 39          2013-03-29 01:08:55 UTC+0000      0      0
17.172.232.105           10.0.1.1                    en1             2                  60          2013-03-29 01:09:16 UTC+0000      0      0
17.172.238.203           10.0.1.1                    en1             0                  58          2013-03-29 01:09:46 UTC+0000      0      0
[snip]

Thursday, June 6, 2013

MoVP II - 4.2 - Dumping, Scanning, and Searching Mac OSX Process Memory

In our previous post we discussed multiple ways of finding process structures in memory. Today we will discuss analysis of a process' address space. First we'll describe how Volatility handles all the possible scenarios that must be understood and properly implemented before you can access process memory on all Mac systems. Then we'll summarize some of the plugins that unlock the potential of Mac memory forensics once you have access to process memory - scanning for bash command history, looking for URLs or passwords in browser processes, dumping shared libraries and mapped files, etc.

Reading Mac Process Memory

The development phase of adding support for Mac process address spaces was a bit challenging. Mac setups have very unusual sharing of user and kernel virtual addressing and they use different architectures for processes and the kernel. This is drastically different from Windows and Linux.

To determine which hardware architecture to assign a process both the value of "x86_64_flag" as well as the process architecture must be known. The "x86_64_flag" tells whether the hardware used on the computer from the memory sample is capable of running in 64 bit mode or not.

With this information we can discuss all of the possibilities that Mac presents. If you would like to see the code that implements this logic, read the get_process_address_space function.

32 bit process on non-64 bit capable systems

This occurs on old computers that are not capable of running in 64 bit mode. The only sample we received like this came from a very old Mac that was running 10.5.x. On these systems, there is no splitting of the virtual addresses between userland processes and the kernel. This means we need to instantiate a new 32 bit PAE address space with the dtb value of the process.

32 bit process on 64 bit capable systems

This occurs when a 32 bit process is running on a 64 bit capable system. For this we must force a 64 bit address space to correctly translate process memory even though the process is running as 32 bit. 

64 bit process running on a 32 bit system

This occurs when 64 bit processes are running on a 32 bit kernel (no other major operating system supports this). We must force a 64 bit address space to properly translate process memory.

64 bit process on a 64 bit system

This is true 64 bit addressing and simply requires the use of the 64 bit address to correctly translate addresses.

Mac's very odd combinations of translation requirements is one of the stranger things we have encountered during memory forensics research and required a team effort to get all the details and possibilities sorted and tested.

mac_proc_maps

This plugin walks a process' memory mappings and prints the PID and name of the process along with the starting and ending address, permissions, and path of mapped file (if any), for each mapping.


$ python vol.py --profile=MacMountainLion_10_8_3_AMDx64 -f ~/10.8.3.mmr.macho mac_proc_maps --pid=1 
Volatile Systems Volatility Framework 2.3_alpha
Pid      Name                 Start              End                Perms     Map Name
-------- -------------------- ------------------ ------------------ --------- --------
1        launchd              0x000000010630c000 0x0000000106333000 r-x       Macintosh HD/sbin/launchd 
1        launchd              0x0000000106333000 0x0000000106335000 rw-       Macintosh HD/sbin/launchd
1        launchd              0x0000000106335000 0x000000010633b000 r--       Macintosh HD/sbin/launchd
1        launchd              0x000000010633b000 0x000000010633c000 r--        
1        launchd              0x000000010633c000 0x000000010633f000 r-x       Macintosh HD/usr/lib/libauditd.0.dylib
1        launchd              0x000000010633f000 0x0000000106340000 rw-       Macintosh HD/usr/lib/libauditd.0.dylib
1        launchd              0x0000000106340000 0x0000000106343000 r--       Macintosh HD/usr/lib/libauditd.0.dylib
1        launchd              0x0000000106343000 0x0000000106344000 r--       
1        launchd              0x0000000106344000 0x0000000106345000 rw-       Macintosh HD/private/var/db/dyld/dyld_shared_cache_x86_64
[snip]

This can be used to determine which shared libraries a process is using as well as where the stack and the heap are. If you want to analyze a specific region of memory, you will need to know the starting address of the mapping in order to pass it to mac_dump_maps.

mac_dump_maps

This plugin writes specified regions of process memory to disk. If no filters are specified then it dumps all regions from all processes to disk, which will likely be overwhelming unless you are looking to mass scan using tools such as AV or Yara.

In this example we dump the launchd binary from memory to disk. It could then be loaded into any reverse engineering tool. The starting address comes from the previous mac_proc_maps output.

$ python vol.py --profile=MacMountainLion_10_8_3_AMDx64 -f ~/10.8.3.mmr.macho mac_dump_maps --pid=1 --map-address=0x000000010630c000 --outputfile=launchd.binary.dmp
Volatile Systems Volatility Framework 2.3_alpha

Wrote 159744 bytes

$ file launchd
.binary.dmp
launchd
.binary.dmp: Mach-O 64-bit executable x86_64

mac_yarascan

Volatility already provides you with the ability to scan Windows and Linux memory dumps with yara signatures. There's no reason Mac should be an exception! Now you can run your rules against all of your Mac memory dumps as well.

$ python vol.py --profile=MacMountainLion_10_8_3_AMDx64 -f ~/Desktop/Storage/memory/Mac/10.8.3/10.8.3.mmr.rawpad mac_yarascan -p 261 -Y "http"
Volatile Systems Volatility Framework 2.3_beta

Task: Google Chrome pid 261 rule r1 addr 0x73c6a0d
0x00000000073c6a0d  68 74 74 70 73 3a 2f 2f 63 6f 64 65 2e 67 6f 6f   https://code.goo
0x00000000073c6a1d  67 6c 65 2e 63 6f 6d 2f 70 2f 76 6f 6c 61 74 69   gle.com/p/volati
0x00000000073c6a2d  6c 69 74 79 2f 77 69 6b 69 2f 52 65 6c 65 61 73   lity/wiki/Releas
0x00000000073c6a3d  65 32 33 52 65 6c 65 61 73 65 32 33 20 2d 20 76   e23Release23.-.v

Task: Google Chrome pid 261 rule r1 addr 0x73c6acf
0x00000000073c6acf  68 74 74 70 3a 2f 2f 65 6e 2e 77 69 6b 69 70 65   http://en.wikipe
0x00000000073c6adf  64 69 61 2e 6f 72 67 2f 77 69 6b 69 2f 54 7a 5f   dia.org/wiki/Tz_
0x00000000073c6aef  64 61 74 61 62 61 73 65 01 00 00 2e 37 9a ee 58   database....7..X
0x00000000073c6aff  90 57 00 00 81 3d 8b 25 0a 00 82 27 41 01 01 06   .W...=.%...'A...

Task: Google Chrome pid 261 rule r1 addr 0x9bc70e0
0x0000000009bc70e0  68 74 74 70 73 3a 2f 2f 74 77 69 74 74 65 72 2e   https://twitter.
0x0000000009bc70f0  63 6f 6d 2f 67 6c 65 65 64 61 00 00 36 00 2c 00   com/gleeda..6.,.
0x0000000009bc7100  31 00 32 00 30 00 35 00 37 00 30 00 31 00 2c 00   1.2.0.5.7.0.1.,.
0x0000000009bc7110  36 00 32 00 38 00 38 00 39 00 30 00 39 00 34 00   6.2.8.8.9.0.9.4.

Conclusion


In this post we have discussed how to analyze and access userlarnd memory of Mac OS X processes. We have also discussed how Mac utilizes differing hardware architectures and virtual address translation schemes in ways not done by any other major operating system. The ability to dump, scan, and search process memory gives you the ability to attribute data back to its owning process and identify which process(es) had access to data that may be interesting to your investigation.

Wednesday, June 5, 2013

MOVP II - 4.1 - Leveraging Process Cross-View Analysis for Mac Rootkit Detection

In our final week of Month of Volatility Plugins II we will analyze the wide range of memory forensics capabilities against Mac OS X systems that are included in the latest release of Volatility (version 2.3). These capabilities span 38 different builds including 32- and 64-bit 10.5.x through 10.8.3, which is the latest version at the time of writing.

Our post today will cover finding processes in a number of places in kernel memory and analyzing information about them. In the end we will discuss the mac_psxview plugin, which is a powerful plugin for detecting hidden processes.

mac_pslist

This plugin enumerates processes by walking the allproc list. It then prints the virtual address, name, PID, user and group ID, and architecture of the process (32 or 64 bit). Read our post tomorrow on process memory for the importance of accurately determining the per-process architecture.

$ python vol.py --profile=MacMountainLion_10_8_3_AMDx64 -f 10.8.3.mmr.macho mac_pslist
Volatile Systems Volatility Framework 2.3_alpha
Offset             Name                 Pid      Uid      Gid   PGID     Bits         DTB                Start Time
------------------ -------------------- -------- -------- ----- --------
0xffffff8032be4ea0 image              4175     0        0        4167     64BIT        0x317e7e000 2013-03-29 12:16:20 UTC+0000
0xffffff803dfdea40 coresymbolicatio   4173     0        0        4173     64BIT        0x4114c0000 2013-03-29 12:16:18 UTC+0000
0xffffff8032498d20 MacMemoryReader    4168     0        0        4167     64BIT        0x3f94a8000 2013-03-29 12:16:17 UTC+0000
0xffffff803dfe0020 sudo               4167     0        20       4167     64BIT        0x414a34000 2013-03-29 12:16:15 UTC+0000
0xffffff803dfe1a60 mdworker           4164     89       89       4164     64BIT        0x3f70cf000 2013-03-29 12:15:32 UTC+0000
0xffffff80370af760 DashboardClient    4160     501      20       275      64BIT        0x3e5bd9000 2013-03-29 12:14:36 UTC+0000
0xffffff803634ba60 CVMCompiler        4127     501      20       4127     64BIT        0x16692b000 2013-03-29 12:10:58 UTC+0000
0xffffff80370b11a0 cookied            4126     501      20       4126     64BIT        0x3137cc000 2013-03-29 12:10:58 UTC+0000
0xffffff803dfe1600 WebProcess         4124     501      20       4121     64BIT        0x3f235a000 2013-03-29 12:10:57 UTC+0000
0xffffff803249c600 taskgated          4122     0        0        4122     64BIT        0x3f3038000 2013-03-29 12:10:57 UTC+0000
0xffffff80314a9d40 Safari             4121     501      20       4121     64BIT        0x3f616c000 2013-03-29 12:10:57 UTC+0000
[snip]

Note:
Our testing of Mac memory acquisition tools showed that at some point every tool smeared the process list and would throw the plugin into an endless loop on a process that was exiting/had exited after the acquisition began. These processes would have invalid "next" pointers due to their being out of sync with the rest of the acquired processes. Due to the frequency in which we saw this issue, we added a check in the plugin and once this condition is detected, the following is printed and the plugin exits:

"Recursive process list detected (a result of non-atomic acquisition). Use mac_tasks or mac_psxview"

mac_psaux

This plugin enumerates processes, but instead of printing the name from the kernel buffer, it reads the command line arguments from process memory.  Knowing the arguments is very useful

mac_pstree

The pstree plugin shows the parent/child relationship between processes. This is very helpful when trying to find the source of a process, such as user vs daemon, user vs malware, and so on. In general, there will be a kernel_task process with PID 0 followed by a launchd process with PID 1. All other processes will then be the child of this initial PID 1 process.  As can be seen in the following output, this relationship is shown by the number of dots before each process name.

$ python vol.py --profile=MacMountainLion_10_8_2_AMDx64 -f Mac-10.8.2.vmem mac_pstree
Volatile Systems Volatility Framework 2.3_beta
Name                 Pid             Uid
kernel_task          0               0
.launchd             1               0
..com.apple.dock.e   208             501
..IMRemoteURLConne   206             501
..filecoordination   205             0
..launchd            200             88
...cfprefsd          203             88
..xpcd               172             501
..coreaudiod         166             202
..apsd               154             0
..locationd          143             205
..launchd            128             92
...CVMCompiler       130             92
..CVMServer          127             0
..launchd            117             501

mac_tasks

mac_tasks enumerates processes by walking the "tasks" list in the kernel and then using the "bsd_info" member of each task to determine the associated process. Due to the smearing issues with mac_pslist, the tasks plugin is used to generate a list of processes for the per-process information plugins we will learn about throughout the week.


$ python vol.py --profile=MacMountainLion_10_8_3_AMDx64 -f ~/10.8.3.mmr.macho mac_tasks
Volatile Systems Volatility Framework 2.3_alpha
Offset             Name                 Pid      Uid      Gid      PGID     Bits         DTB           Start Time
------------------ -------------------- -------- -------- -------- ------   ----         ------------  --------------------   
0xffffff800fada2d0 kernel_task          0        0        0        0        64BIT        0x11e9f000    2013-03-29 01:08:47 UTC+0000
0xffffff80314aaa60 launchd              1        0        0        1        64BIT        0x11234000    2013-03-29 01:08:47 UTC+0000
0xffffff80314a98e0 UserEventAgent       11       0        0        11       64BIT        0xbe18000     2013-03-29 01:08:49 UTC+0000
0xffffff80314aa1a0 kextd                12       0        0        12       64BIT        0xbecb000     2013-03-29 01:08:49 UTC+0000
0xffffff80314a9480 notifyd              14       0        0        14       64BIT        0x23b9b000    2013-03-29 01:08:49 UTC+0000
0xffffff80314a9020 securityd            15       0        0        15       64BIT        0x1dd43000    2013-03-29 01:08:49 UTC+0000
[snip]

As shown in the output, mac_tasks uses the same rendering (print) function as mac_pslist.

mac_pgrp_hash_table

This plugin enumerates processes by walking the process group hash table, pgrphashtbl. It uses the same rendering function as mac_pslist and mac_tasks.

mac_pid_hash_table

This plugin enumerates processes by walking the process ID hash table, pidhashtbl.  It uses the same rendering function as mac_pslist and mac_tasks.

mac_psxview

The process cross view function is used to find hidden processes by comparing the set of processes found from each source. If we look at the output of the plugin, we see the offset, name, and PID for each process along with a True or False if it was found in each source:

$ python vol.py --profile=MacMountainLion_10_8_3_AMDx64 -f ~/Desktop/Storage/memory/Mac/10.8.3/10.8.3.mmr.macho mac_psxview
Volatile Systems Volatility Framework 2.3_alpha
Offset(P)          Name                    PID pslist parents pid_hash pgrp_hash_table session leaders task processes
------------------ -------------------- ------ ------ ------- -------- --------------- --------------- --------------
0xffffff800fada2d0 kernel_task               0 True   True    False    True            True            True          
0xffffff80314aaa60 launchd                   1 True   True    True     True            True            True          
0xffffff80314a98e0 UserEventAgent           11 True   False   True     True            True            True          
0xffffff80314aa1a0 kextd                    12 True   False   True     True            True            True          
0xffffff80314a9480 notifyd                  14 True   False   True     True            True            True          
0xffffff80314a9020 securityd                15 True   False   True     True            True            True          
0xffffff80314a8bc0 diskarbitrationd         16 True   False   True     True            True            True          
0xffffff80314a8760 configd                  17 True   False   True     True            True            True 

The columns that map directly to plugins we previously discussed are pslist, pid_hash, pgrp_hash_table, and task processes. The two columns that were not discussed are parents and 'session leaders'. Parents gathers tasks by walking the process list and retrieving the parent process pointer for each process. This would detect rootkits that unlink a process that has active children. 'Session leaders' leverages the mac_list_sessions plugin and gathers the process that is the leader of each session.

Note: As with the Windows and Linux versions of psxview, just because a column says False does not immediately mean a process is hidden. For example, every process does not spawn child processes, so they will not all appear in parents. Similarly, not every process is a session leader.

psxview is a very powerful plugin as a rootkit would have to hide the process from potentially six different sources while still keeping the system stable.

Conclusion

In this blog post we have covered a number of plugins that are able to recover processes from OS X kernel memory as well as the psxview plugin that can use these to detect rootkits. Tomorrow we will discuss OS X process memory as well as the oddities of the OS that caused us quite a few headaches while developing the capabilities.